Submitted by Administrator on Thu, 25/10/2018 - 08:26
A huge thank you to everyone who came to our presentation last week! We enjoyed both the Sensor PhD Showcase and Sensors Day very much and hope you did as well. The presentation we gave is a bit too large to upload (over 100MB) - we shouldn’t have shown so many small videos! We will prepare a condensed version without the videos and upload it to the website in the next few days. Until then, the most important results that we presented are shown below, so read on!
We have analyzed more than 150 hours of data, more than 2 million datapoints. This sounds like a lot but over the coming months, we would like to have billions! So please be patient, we are building new sensors every week.
Lots of data
Finally, here are time-resolved maps of the Cambridge city centre! Grouped in morning and afternoon, it is very interesting to see which way people go.
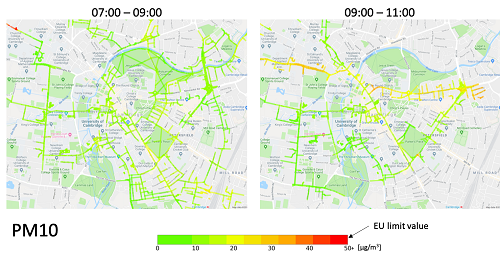
From 7 to 9 am when commuters arrive in the city, we can see that the highest PM levels are found around the station and on the way into the city centre. That’s logical - and we are glad to see this. But what happens later in the day, when lazy PhD students slowly wake up? From 9 to 11 am, the highest levels are found on Newmarket Road and on Madingley Road (where the PhD students go to work). On these maps, we show the averaged data from areas where we have the most data points. As can be seen easily, most people come into the city centre before 9 am, and between 9 and 11, most volunteers were moving around in the city centre itself (not even including the train station), coming in from Madingley Road or going to West Cambridge. What about later in the day?
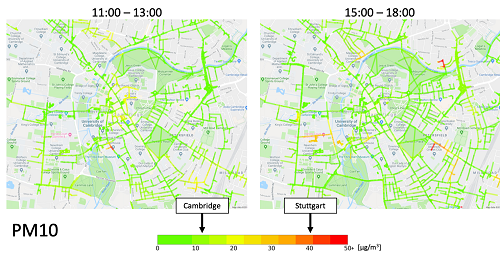
We can see the activity around the city centre increases, as do the PM values, probably as people are going in and out for lunch. A very interesting plot is shown on the right side: the post school time/afternoon rush hour. You can see Mill road getting a lot busier around that time, as well as a few other areas, as one might expect. We can clearly see a difference in Tenison Raoad, close to Mill Road. There is a primary school and it's pretty clear that there may be a lot parents coming to pick up their children with cars, as shown by that hotspot of high PM values. If that is the case, they should be considering the comparatively bad air their children breathe in every day.
However, not all is that bad! From our data we can see that Cambridge has on average has much lower PM values than some other areas around the world. For example, compared to Stuttgart in Germany, where a large, stationary network using the same PM sensors is currently active, and that we can therefore directly compare to, the air quality in Cambridge is much better.
But we also have speed data, and here we show the map:
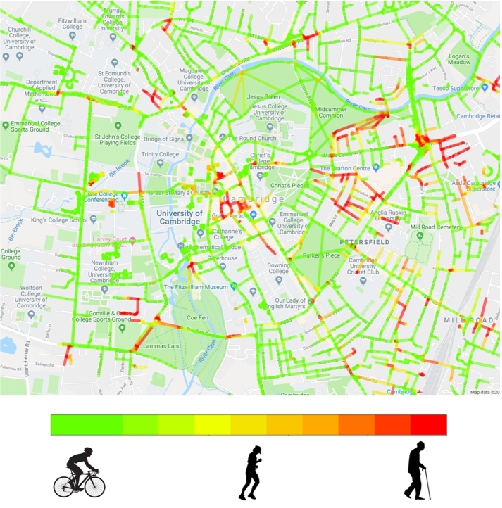
In green areas, you are making the most of the bike. In yellow areas, you could be doing better, but it’s probably not your fault. It’s probably the bunch of tourists who are getting in your way, such as around the library. And then there are the red areas, where you are better off walking. There are also some areas, such as the market square, where people are not actually riding their bike but walk instead which is why it appears in red.
You can also look at some results directly on our website at cambikesensor.net/results. You can find the plots as well as non-geotagged data. To access the geotaggged data (that’s the interesting part), just email us and we will send you the file. We have removed every first and last 200m of every recorded track, ensuring the privacy of our volunteers.
Recap: Sensors PhD Showcase and Sensors Day 2018
Again, thank you for coming! Both days were a real success and we got the opportunity to talk to many interested people. There were lots of amazing talks and we would like to thank all the organisers for making the two wonderful days possible. Especially Karen and Oliver, who had the idea of CamBike bike lights! Below are some pictures.
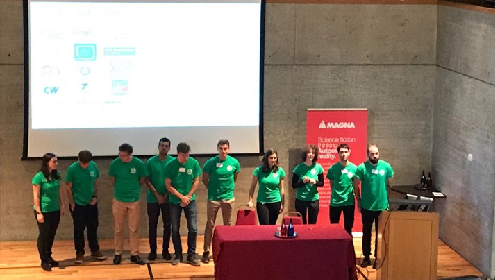
The CamBike Team after the presentation
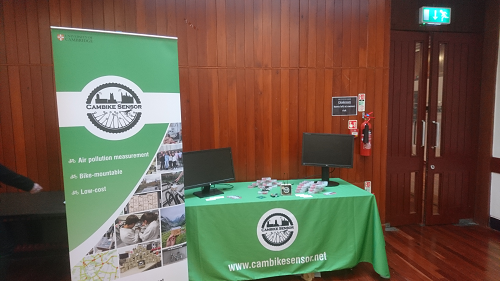
The CamBike Sensor stand. Empty, because we took the picture before the conference attendees came
CamBike in Argentina
The sensor has made the long journey successfully. We just got a first picture from Buenos Aires (and more once the weather is better).
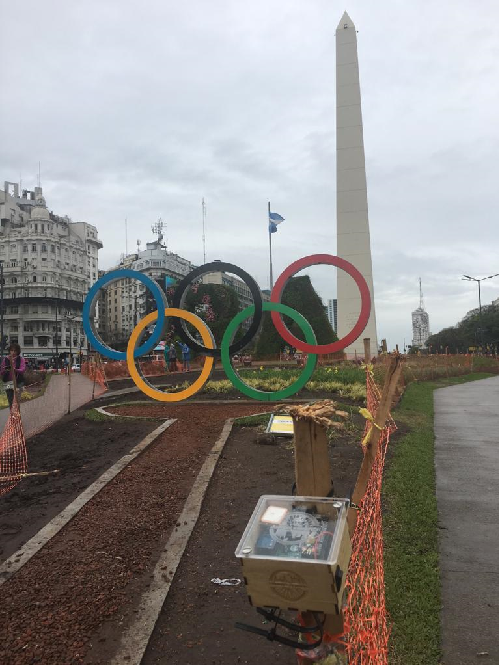
Norberto Vidal, the Secretary of Environment and Sustainable Development in Argentina, is going to test it there in the next weeks. We are looking forward to the results (and possible challenges).
Distribution
Distribution is ongoing. We are building sensors for you as fast as we can, but it is still a lengthy process. We will let you know as soon as the next batch is ready to hit the road!
What’s next?
We will have quite a few meetings over the course of the next days, we are for example looking into incorporating Alphasense sensors (www.alpha-sense.com) to extend our measurements to different gases. But now we will really focus on distribution. We will let you know once we have a date and location for the next bigger distribution event.

